In short
Around 214,000 bike thefts were reported in Germany in 2025 (−13 % year on year), and only about one case in nine is solved; per head of population, the riskiest places are university cities such as Münster, Göttingen and Freiburg (source: PKS 2025).
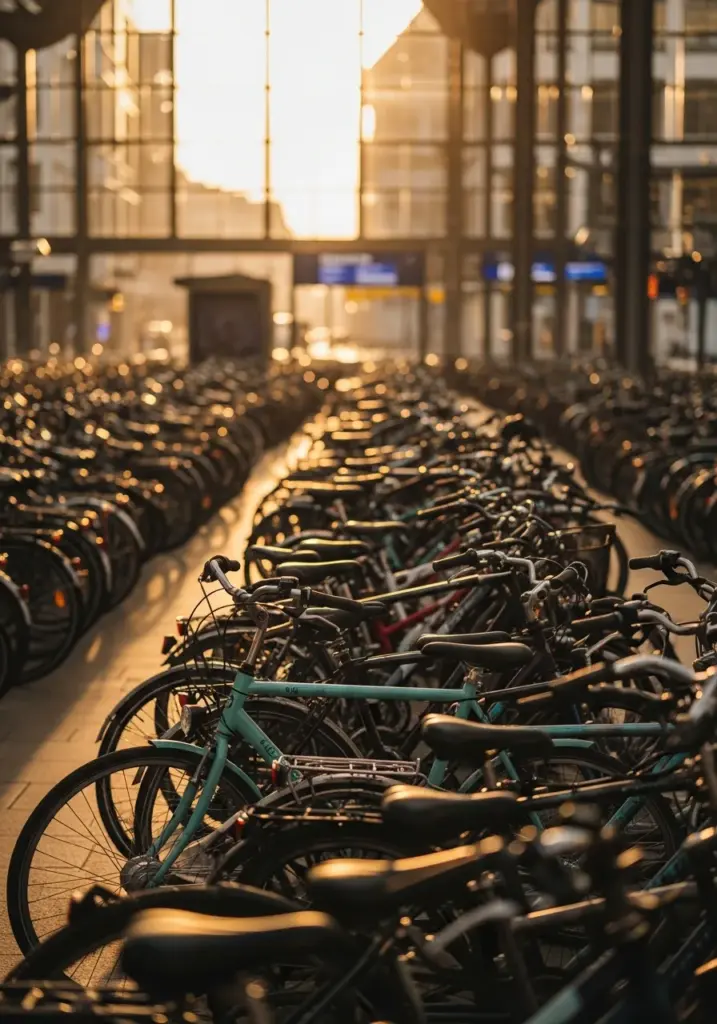
At the station there is a gap in the bike rack. A severed lock shackle lies on the tarmac, next to a water bottle that nobody will collect. For the owner it is a miserable day; for the statistics it is one line.
In 2025 those lines added up to around 214,000 in Germany, a drop of 13 % compared with the previous year (source: German police crime statistics, Polizeiliche Kriminalstatistik 2025). That sounds like relief. Look more closely and you soon notice that the figure says less about the problem than you would expect.
A quick word on the basis, so that we mean the same thing: the Polizeiliche Kriminalstatistik (PKS), the German police crime statistics, is an annual police analysis that counts reported offences, sorts them by type of crime and breaks them down regionally to city level. It is not a survey of how many bikes actually disappear, but a count of the cases someone has reported. What is not reported does not exist for the PKS. That limit runs through every figure in this text.
How many bikes are stolen in Germany?
For 2025 the German police crime statistics record around 214,000 reported bike thefts, 13 % fewer than in the previous year (source: PKS 2025). That is the most reliable figure available on the subject. It is still a lower limit.
Because only what reaches the police is counted. Many victims do not file a report, because they rate their chances as low, because a trip to the station costs time, or simply because they do not have the frame number, without which a proper report is barely possible. The PKS does not show how large this share is, and nobody can put a serious number on it.
On top of that comes a second gap. If only part of your bike disappears, it does not show up as a bike theft: the battery from its mount, the saddle including the seatpost, a complete wheelset. The loss is real, but it is not in the bike statistics.
And the 13 % drop? It can mean that less was stolen. It can also mean that less was reported. The statistics themselves do not separate the two.
Which city has the most bikes stolen?
Measured against population size, university cities lead the way, with Münster out in front. The reason is less dramatic than the ranking sounds: where almost everyone rides a bike every day, there are simply more bikes standing around that can be stolen at all. The metric “per 100,000 inhabitants” makes cities of different sizes comparable and therefore shows your statistical risk in a given place, not the sheer number of cases.
| City | Thefts per 100,000 inhabitants (PKS 2025) | What the figure tells you | What it does not tell you |
|---|---|---|---|
| Münster | around 1,500 | A very high share of everyday cycling, and correspondingly many opportunities. | Nothing about individual districts or your specific parking spot. |
| Göttingen | around 1,300 | A classic university city with densely packed parking areas at the campus and the station. | Nothing about how well the bikes involved were secured. |
| Freiburg | around 1,100 | A high share of cycle traffic, with many bikes parked in public for long periods. | Nothing about the value of the stolen bikes. |
If you look at absolute case numbers instead, the big cities dominate. There are more people there, more bikes and therefore more cases, without your personal risk automatically being higher as a result.
| City | Reported cases (PKS-based analyses, 2025) | What the figure shows | What it does not show |
|---|---|---|---|
| Berlin | around 23,000 | The largest absolute number of cases nationwide. | Whether the risk per bike is higher than in smaller cities. |
| Hamburg | around 10,000 | The second-largest number of cases, spread across a very large urban area. | Where the hotspots within the city are. |
| Köln | around 6,400 | A high number of cases in a city of more than a million with growing cycle traffic. | How many cases occur around the station and in the city centre. |
| München | around 5,700 | A large number of cases despite comparatively many private parking spaces. | Whether a police report was filed, or anything reported at all. |
For you as a bike owner, the figure per head of population is the more honest reference. If you live or study in Münster, Göttingen or Freiburg, a good lock is not a nice-to-have. It is basic equipment.
The same applies to cities that do not reach the top values. Where many people cycle, there are many targets. Fatalism would be the wrong lesson to draw; targeted precautions are the right one.
Tip: As a rule of thumb, budget around 10 % of the bike’s value for a good lock. Anyone who breaks open a lock generally commits an aggravated case of theft (§ 243 StGB) – that does not replace your bike, but it shows how seriously the law takes the matter.
What is the clearance rate for bike theft?
According to PKS 2025, the clearance rate for bike theft is around 11 %. Put differently: about one in nine reported cases is solved, and the other eight stay open. That is the most uncomfortable figure in the whole topic.
The statistics do not explain why it is so low. But the core of the problem is easy to follow: a bike with no recorded frame number looks like a thousand other bikes. When the police recover a bike, there is often no clue at all as to who owns it.
This is exactly where it is decided whether a recovered bike comes back to you or languishes in the lost property office. The bottleneck is not the investigative work, but the identification. Our guide “Finding a stolen bike” shows how to proceed if the worst happens, and you can read how to set up a police report properly in “Reporting a bike theft”.
How big is the financial damage from bike theft?
The police count cases, insurers count money. Together that gives a much sharper picture than either figure on its own. The following three metrics come from the 2025 claims figures of the German Insurance Association (Gesamtverband der Deutschen Versicherungswirtschaft, GDV).
| Metric | Value (GDV, 2025) | What lies behind it | What it does not cover |
|---|---|---|---|
| Bikes compensated | 115,000 | Only insured bikes for which a payout was actually made. | All thefts without insurance or without a report. |
| Total payouts | around EUR 150 million | The sum insurers spend on stolen bikes in one year. | Knock-on costs such as loss of mobility or excess payments. |
| Average claim | EUR 1,270 per bike | A record figure that shows how valuable everyday bikes have become. | Your specific bike, which can be well above or below that. |
The average value is the most interesting line. It tells you that a stolen bike is no longer a minor loss today, but a purchase that hurts. Is it worth checking your home contents policy to see whether your bike is covered for a sufficient amount at all? Almost always. Our guide “Home contents insurance and bike theft” explains what to check. Compensation limits vary by provider and tariff, so there is no way around looking at your own contract.
When and where are bikes stolen most often?
Thieves have preferences, and they are hardly surprising. Bikes disappear more often in the warmer months, when more people are out and about anyway and bikes stand outside for longer. In winter the opportunity shrinks, because fewer bikes are parked in public at all.
Geographically, it is always the same places: station forecourts, busy city centres, overcrowded racks outside universities and libraries. Bikes stand side by side there, a stranger with tools barely stands out, and anyone working calmly along the row is guaranteed to find the weakest lock. Volume is camouflage.
High-value bikes and e-bikes are particularly in focus, because they are easier to resell than a twenty-year-old city bike. If you ride something expensive, avoid the places named above or use double security there. Our guide “Parking your bike securely” sorts out which parking spots really hold up.
How high is your personal risk?
No ranking in the world tells you whether your bike in particular will disappear. What you can do: work through the risk drivers that keep appearing in the figures above. The table sorts the typical everyday situations and names what helps in each case and what does not.
| Situation | Why the risk rises | This helps | This does not help |
|---|---|---|---|
| Commuting, bike stands at the station all day | Long standing time at a classic hotspot. | High-quality lock secured to a fixed object, and a supervised cycle station where possible. | Locking the bike only through the wheel. |
| Living in a university city | Very high theft rate per inhabitant. | Match the lock to the value of the bike, choose the parking spot deliberately. | Hoping that a cheap bike is uninteresting. |
| E-bike or cargo bike | High resale value, strong demand among fences. | Combine two security measures, store the frame number and receipts digitally. | Relying on the motor lock alone. |
| Bike stands in a shared cellar | Access for many people, often without sight lines and without a camera. | Lock the bike in the cellar too, do not just park it. | Assuming that a front door stops thieves. |
The rows have one thing in common: they concern decisions you make before anything happens. After that, the statistics only file you away.
Where do bike theft statistics stop helping?
Time for the uncomfortable truth: these figures are weaker than their precision suggests. You should know four limits before you draw conclusions.
They count reports, not thefts. Every change in reporting behaviour shifts the curve, without anything necessarily having changed in reality.
They explain nothing. The PKS describes, it does not give reasons. Whether a lower figure comes from better prevention, more home working or worse weather is not stated there.
They are not a forecast for your bike. A high city figure does not mean your bike will go. A low one does not mean it will stay. Statistics apply to masses, not to individual cases.
They help you not at all after a theft. Once your bike is gone, no rate matters any more. Then only one thing counts: whether you can prove your ownership with the frame number, photos and the purchase receipt. Without that, even a recovered bike stays a bike without an owner.
How do you reduce your risk in practice?
You have no influence on the statistics, but you do on your risk. The following four points take effect exactly where the figures above show the biggest gaps: at the lock, at the parking spot, in identification and with the money.
- A good lock, used properly. Budget around 10 % of the bike’s value for the lock and always secure it to a fixed object, not just through the wheel. The guide “Locking your bike properly” shows how to do that cleanly.
- Choose the parking spot deliberately. Avoid full, unsupervised racks at the station and in the city centre wherever you can. You will find an overview of all the building blocks of theft prevention for your bike on our topic page.
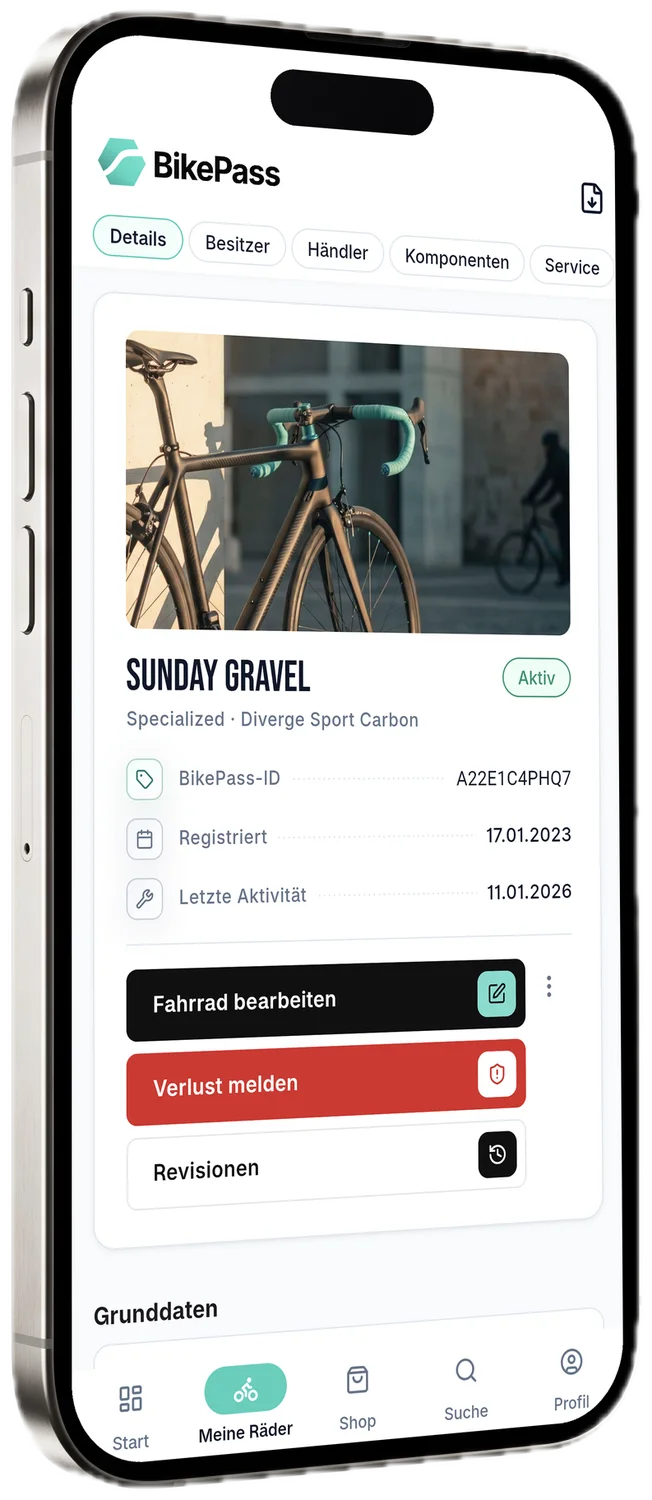
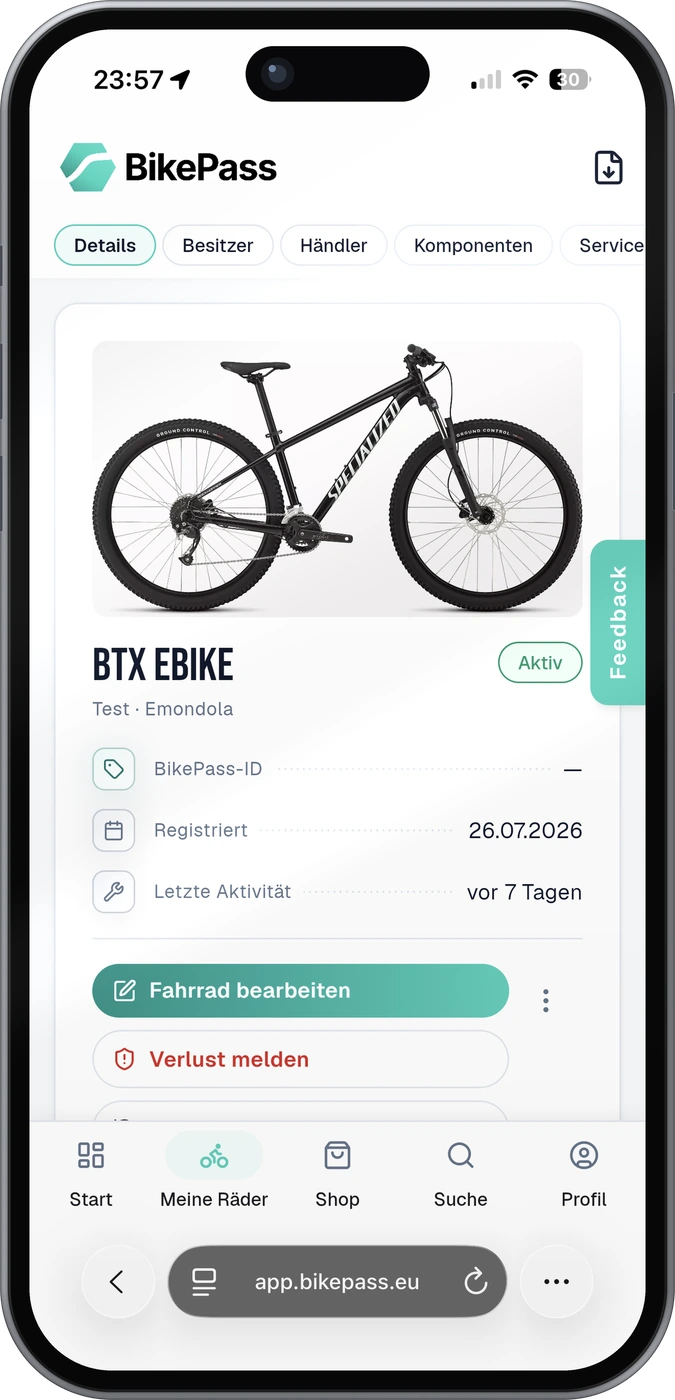
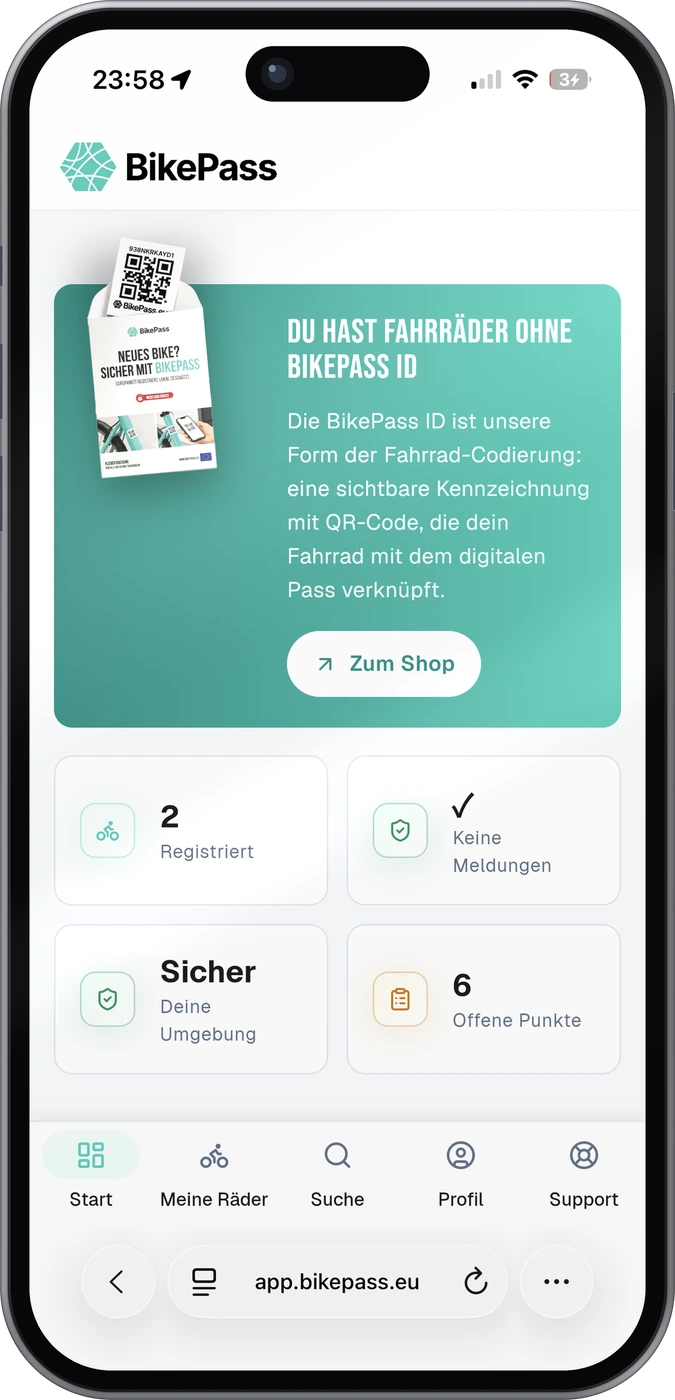
- Registration and security marking as plan B. With a clear-up rate of around 11 %, precaution is worth more than hope. With the free BikePass app you store the frame number, photos and purchase receipt digitally, and with the BikePass ID you additionally mark your bike in a tamper-proof way.
- Check your insurance. If the value of your bike exceeds the compensation limit of your home contents insurance, a close look at the policy pays off, especially with an average loss of 1,270 € (GDV, 2025). The conditions vary from provider to provider.
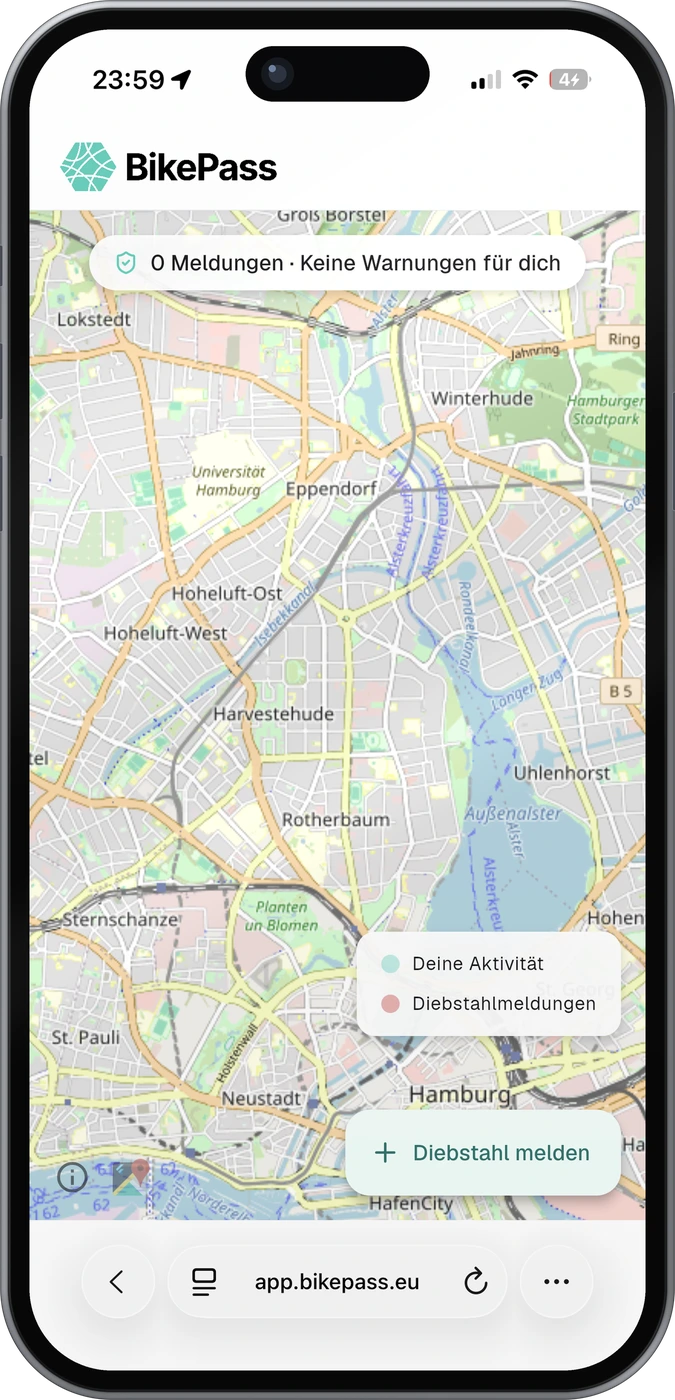
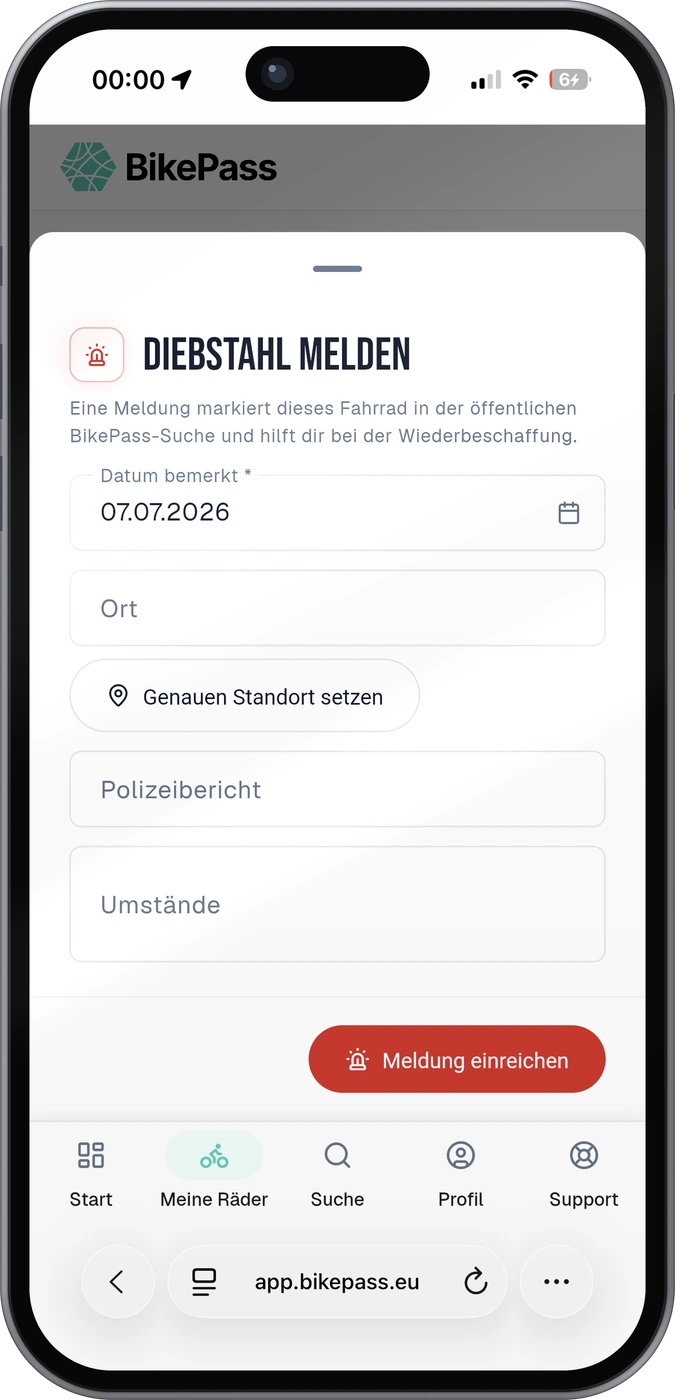
No single point makes your bike untouchable. Together, though, they shift exactly the probabilities this article is about. And the last point still works when the first three have failed. At BikePass you register any number of bikes free of charge, GDPR-compliant and EU-wide, and if the worst happens you report the theft directly in the web app.
Back to the gap in the bike rack at the station. Whether that bike ever turns up again is not decided in the crime statistics, but by whether a frame number matching it is stored somewhere. It will become a line in the statistics either way. Whether it stays a line with your name on it is in your hands.
Your risk checklist
- Have you classed your home area and parking spot as a hotspot?
- Is the lock worth around 10 % of the bike’s value?
- Is the bike always locked to a fixed object, in the cellar too?
- Are the frame number, photos and purchase receipt stored digitally?
- Have you checked your home contents policy for the compensation limit for your bike?
- Have you worked out how and where you would file a police report if the worst happens?
We write about bike theft, security marking and digital theft protection – practical, without scaremongering and with real steps you can take.
See all guides